https://www.slab.org.uk/news/legal-aid-solicitor-data-on-impact-of-covid-19-2/
https://www.slab.org.uk/news/legal-aid-solicitor-data-on-impact-of-covid-19-2/
7 September 2020
The following data provides information on solicitor applications and payments during the Covid-19 pandemic.
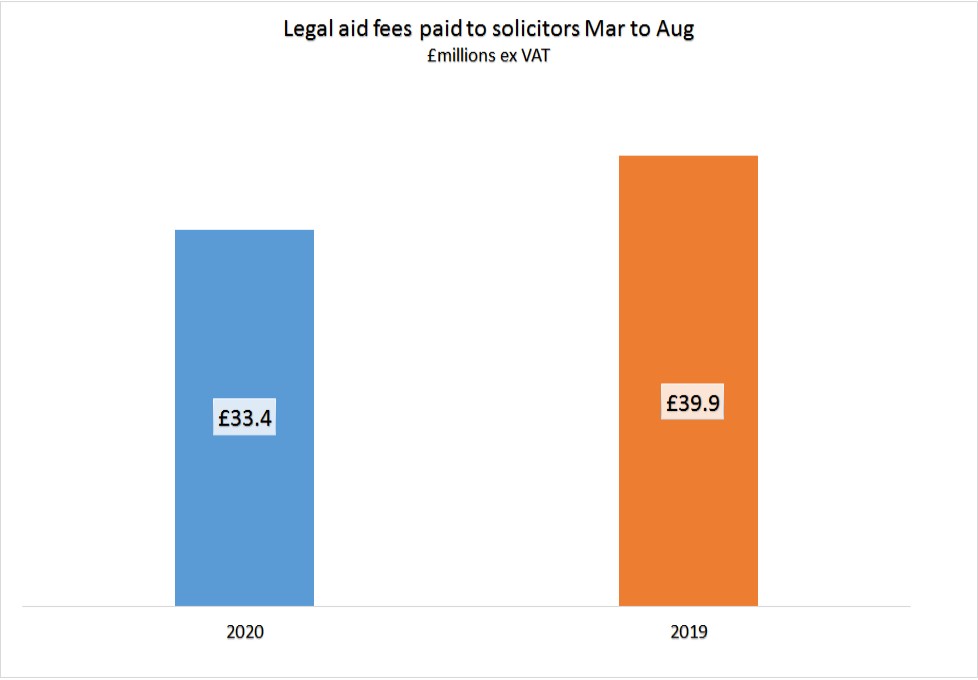
Comparison of the 26 week period from the start of March to the end of August 2020 with the equivalent period in 2019.
There has been a £6.5 million difference i.e. a 16% drop in fees paid.
This does not take account of any financial assistance firms have received from government assistance, such as the furlough scheme or Business Support Scheme.
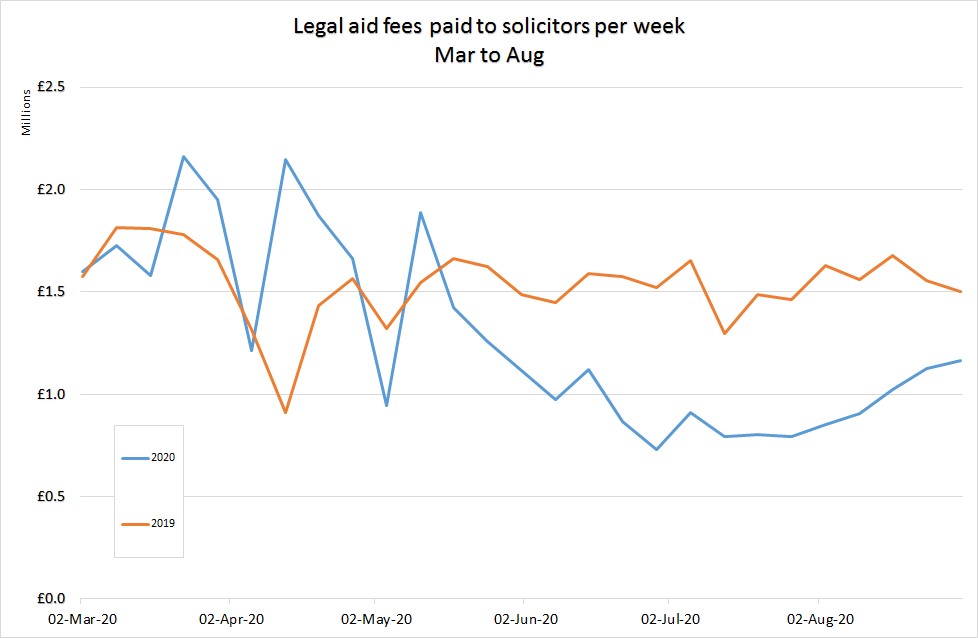
We started to see an impact on solicitors on a weekly basis from the start of March.
We introduced a new approach to interim payments in the second half of March which allowed firms to submit their invoices for work sooner.
Many firms took advantage of this which resulted in a significantly higher level of payments from March into April this year than in 2019.
From May onwards the level of payments decreased as less work was being done.
We are now seeing an increase in payments again back towards the level of last year.
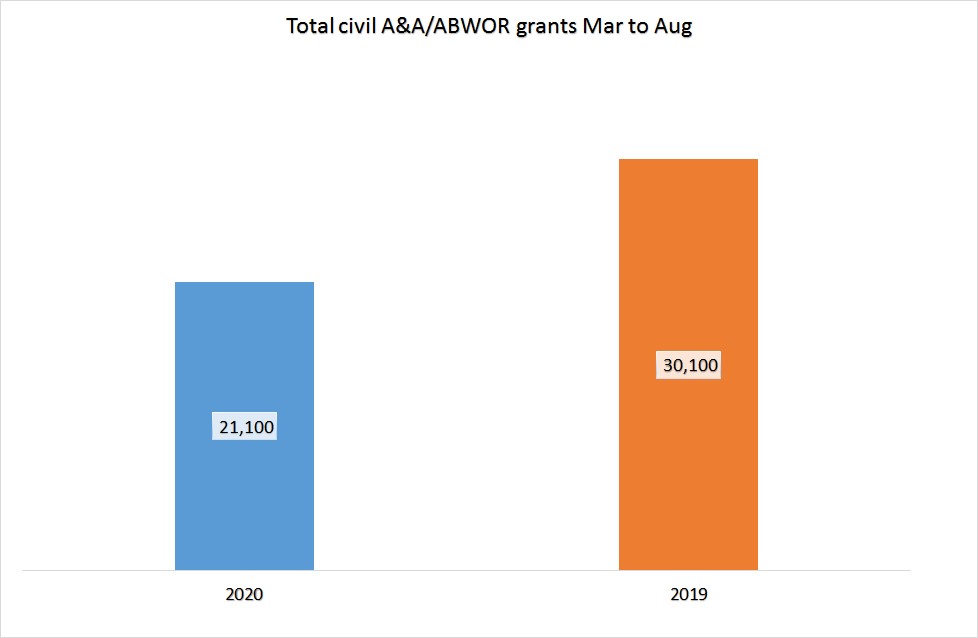
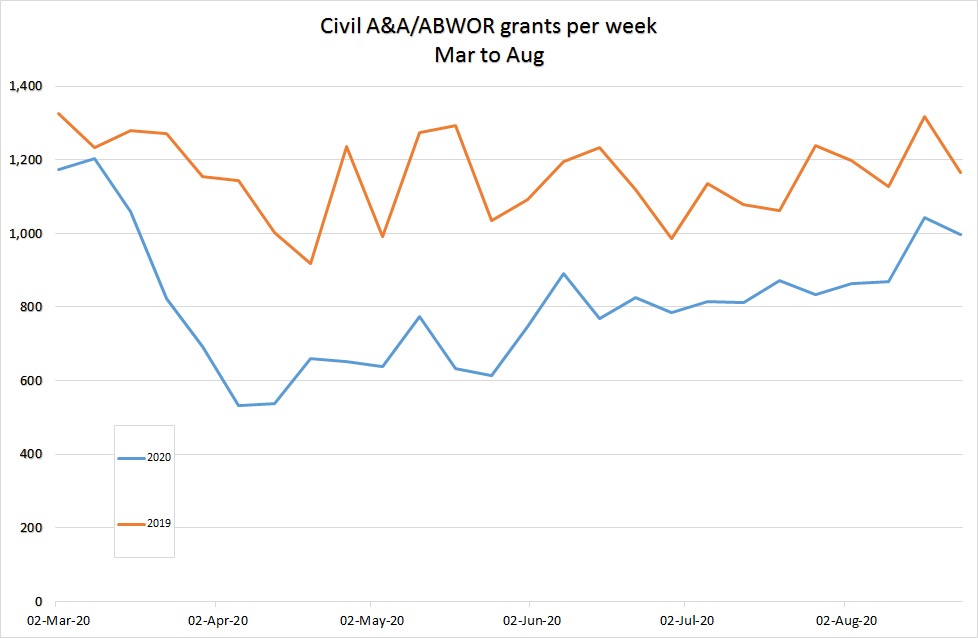
The total number of grants of civil A&A and ABWOR for the 26 weeks from the start of March 2020 to the end of August 2020 is down by 30% on the equivalent period in 2019.
We started to see a decrease in grants in the middle of March 2020 which continued to Easter.
Since then we have seen a steady increase to the last two weeks which are 82% of their 2019 levels.
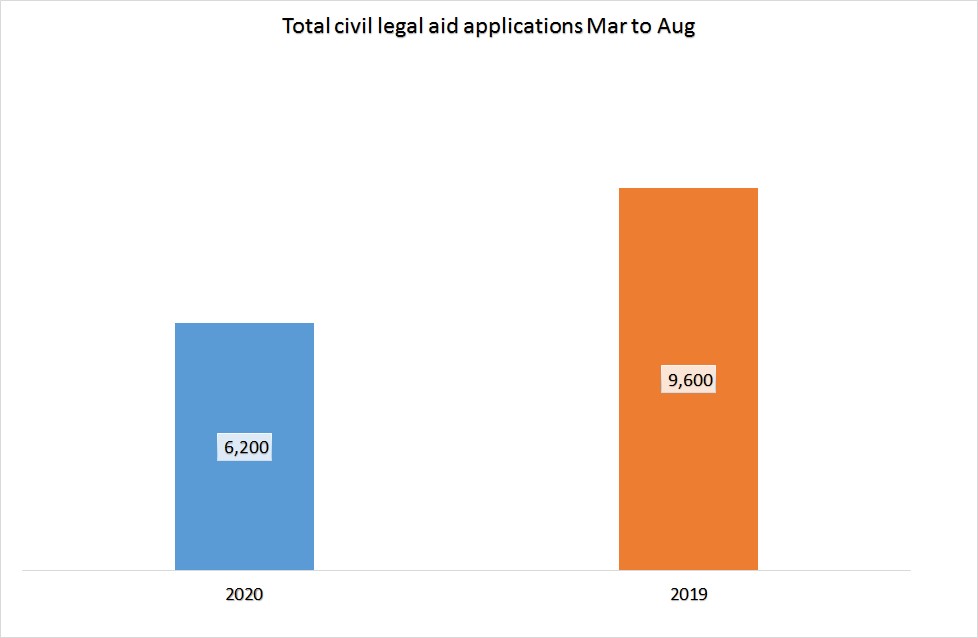
The total number of applications for civil legal aid for the 26 weeks from the start of March 2020 to the end of August 2020 is down by 35% on the equivalent period in 2019.
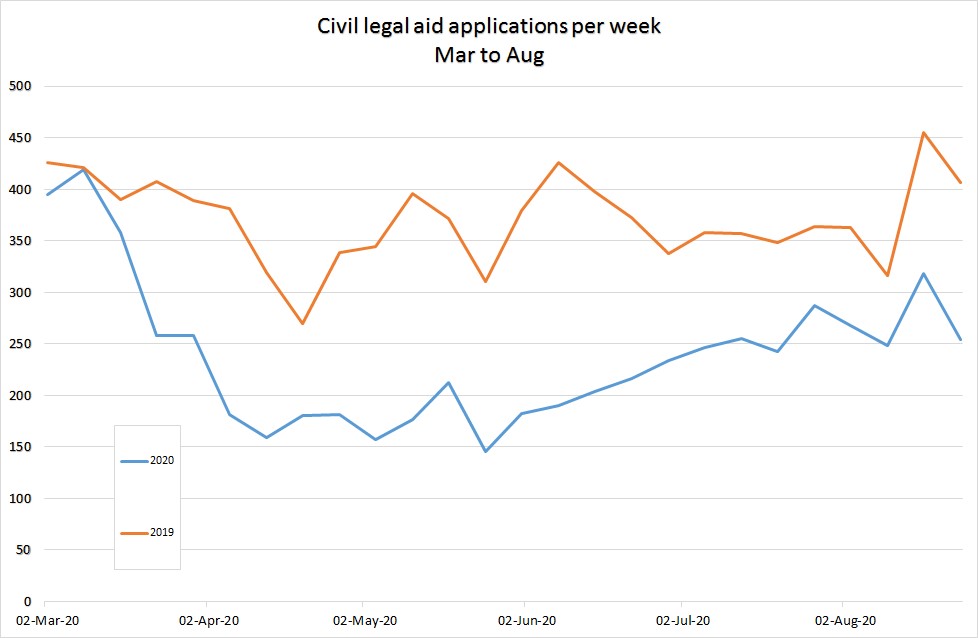
We started to see a decrease in applications in the middle of March 2020 which continued to Easter and beyond.
The level of applications remained at a lower level to the start of June.
Since then we have seen a steady increase to the last two weeks, which are around 70% of their 2019 levels.
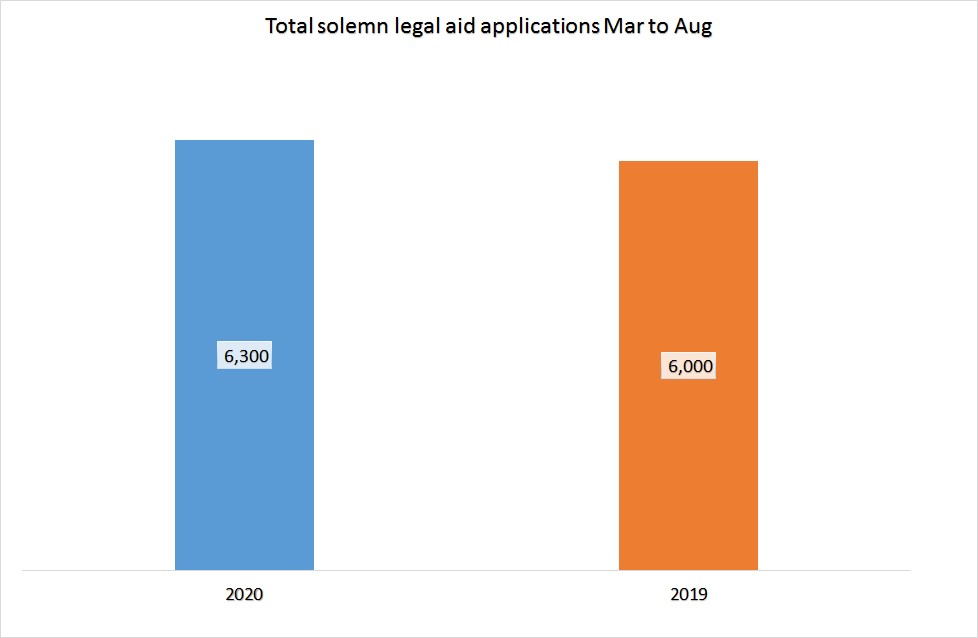
The total number of applications for solemn legal aid for the 26 weeks from the start of March 2020 to the end of August 2020 is up by 4% on the equivalent period in 2019.
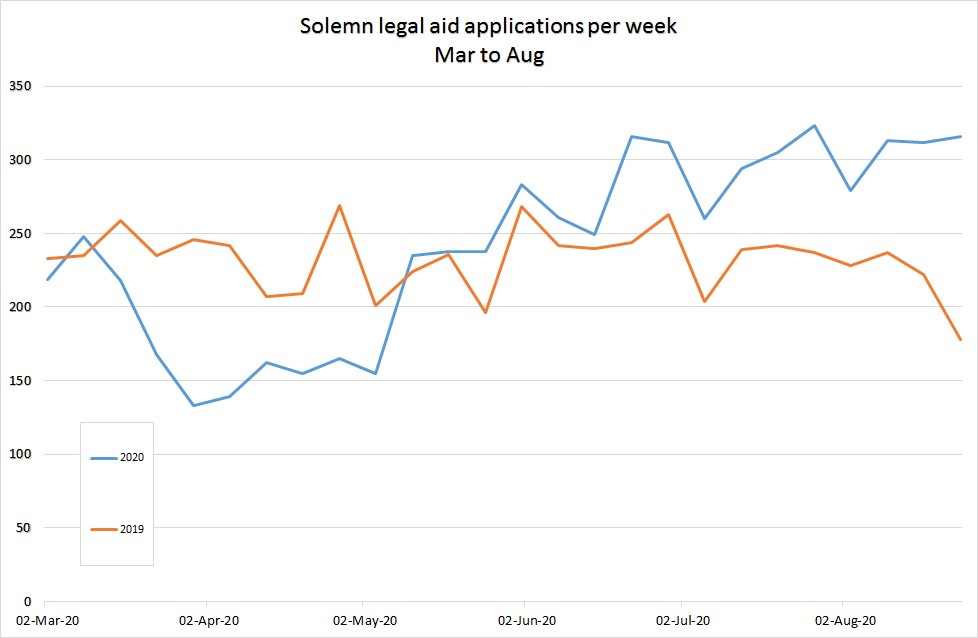
We saw a steep decline in solemn applications in March. The levels started to increase from the start of April and they have been above the levels of last year since the middle of May.
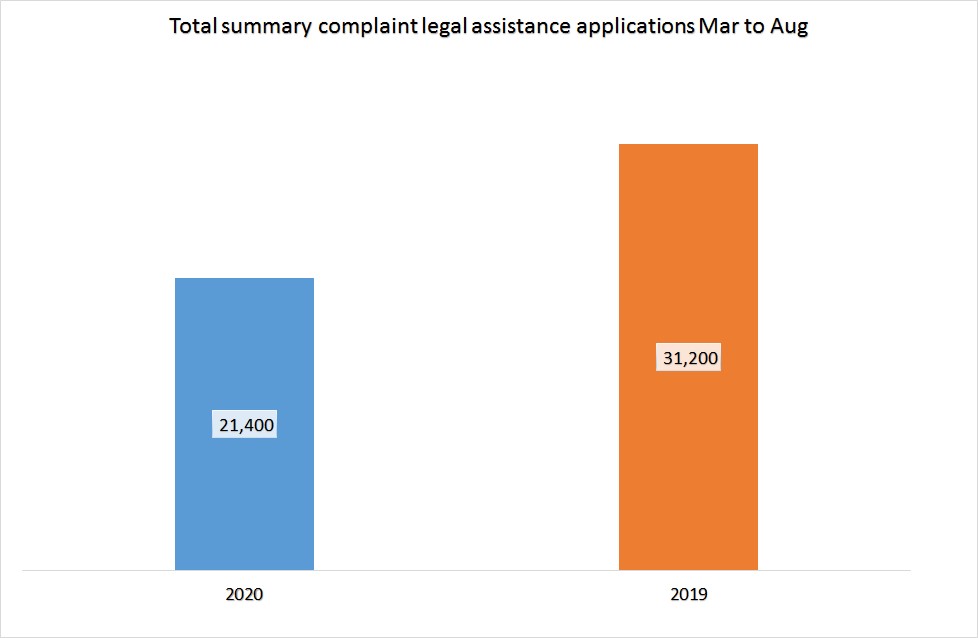
The total number of applications for legal assistance for summary complaints (either legal aid or ABWOR) for the 26 weeks from the start of March 2020 to the end of August 2020 is down by 31% on the equivalent period in 2019.
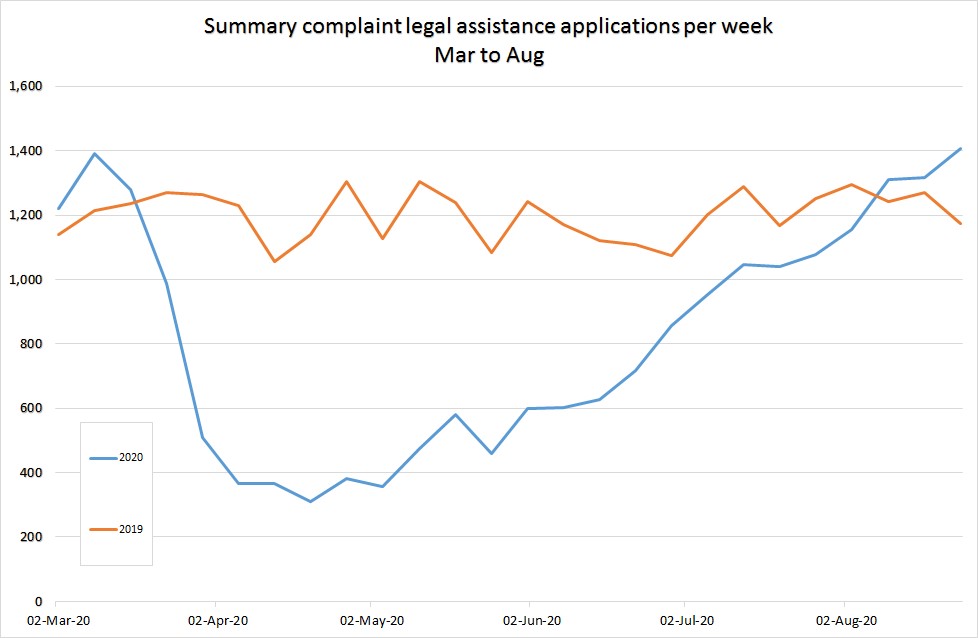
We saw a steep decline in summary complaint applications in March. The levels remained below 400 per week through April but they have increased strongly since then and in recent weeks they have been above 2019 levels.
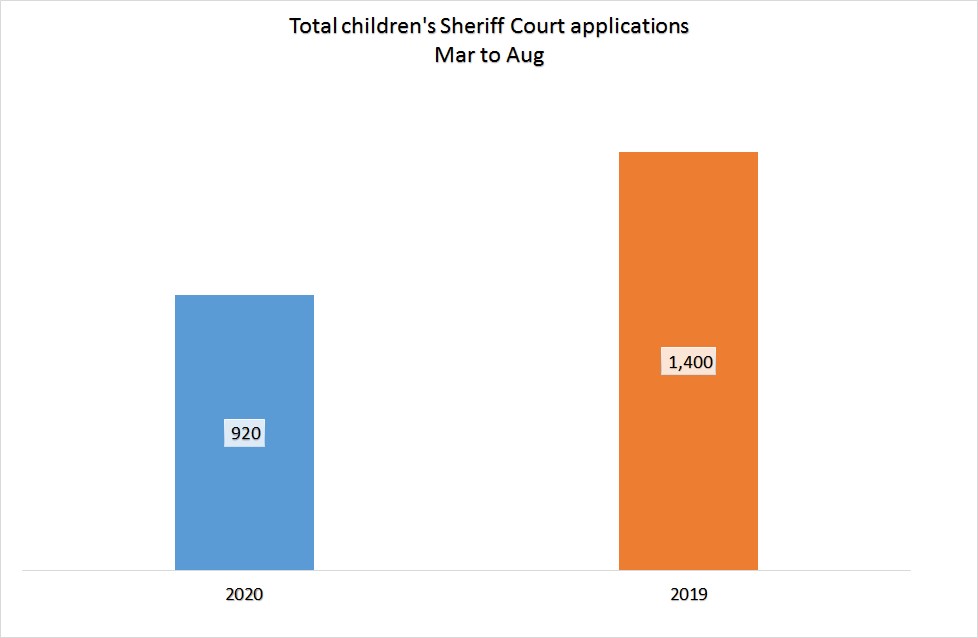
The total number of applications for legal aid for children’s Sheriff Court cases for the 26 weeks from the start of March 2020 to the end of August 2020 is down by 34% on the equivalent period in 2019.
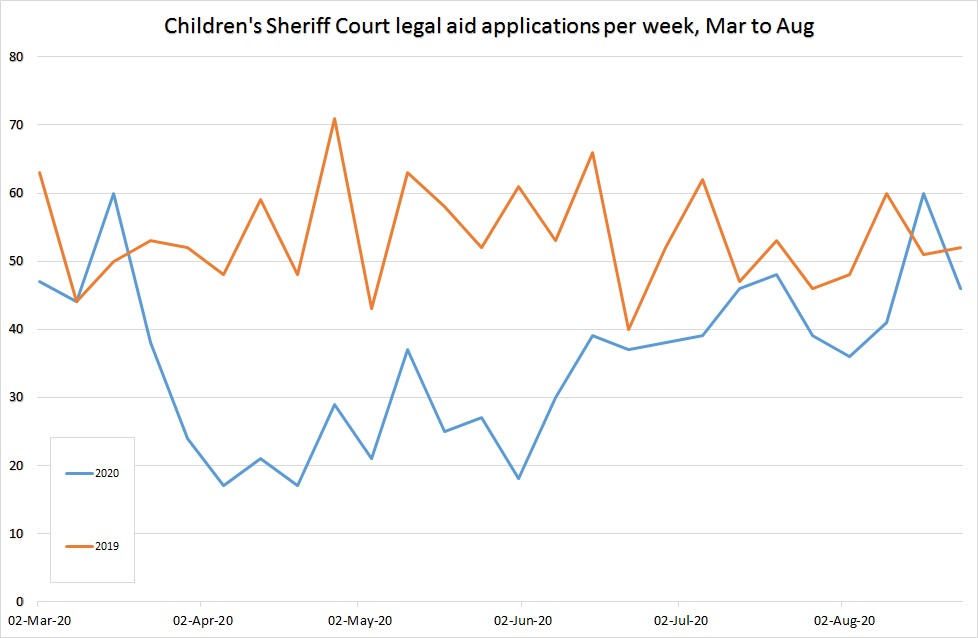
The weekly picture is more varying as the numbers of children’s cases tend to be much lower than other legal assistance areas.
We again saw a drop into April and then a variable increase since then. Current levels are around the same level as 2019.
Please contact Matt Taylor, Analytics Manager: taylorma@slab.org.uk